The High Rate of Growth in Postwar Taiwan
By Tsong-Min Wu*
1. Wages: Mexico and Taiwan
An article entitled “Why Taiwan’s Wages are as Low as Mexico’s” was published in the March 19, 2018, issue of Forbes. The article triggered heated discussion among Taiwan’s media. Many believe that the similar level of wages in the two countries reflects the difficulties Taiwan faces now in its economic development. Two days after the publication of the article, the National Development Council issued a press release claiming that the wage data cited by the article was computed using a different conversion rate. When converted using the same exchange rate of US dollars, Taiwan’s average monthly salary in 2016 was 2.2 times that of Mexico.1
We may wonder whether this article in Forbes that makes a comparison of the wages in Taiwan and in Mexico also triggered discussion in Mexico. And if it did, what was the mainstream reaction? Taiwanese people think that having the same wages in Taiwan and Mexico indicates that Taiwan is suffering from an economic reversal. Do Mexican people think similarly? “Wages in Mexico are as low as those in Taiwan!” Or, the Mexicans’ reaction is just the opposite? “How wonderful that the income level in Mexico is the same as it is in Taiwan!”
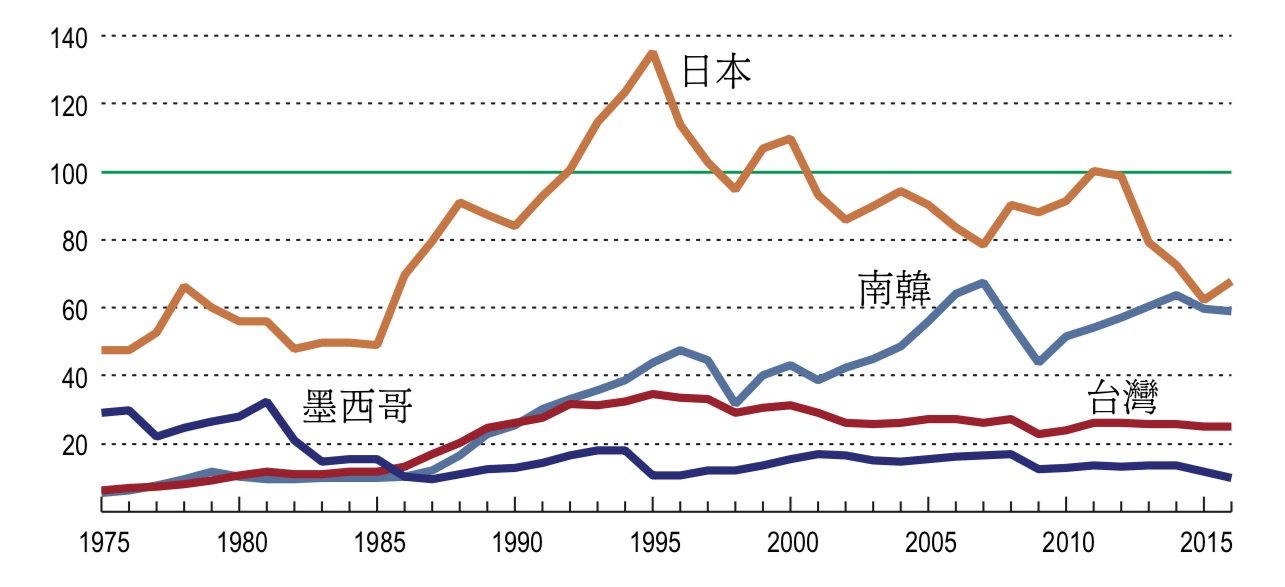
So, in 2016 Taiwan’s average salary was 2.2 times that of Mexico. What about 40 years ago? Many Taiwanese may think that Taiwan’s wages have always been higher than those of Mexico. But that is simply not true. Graph 1 shows the ratio of the average wages in the manufacturing industry of Taiwan and Mexico during the period 1960—1990 against those of Japan (Japan = 100). In 1990, the wages in both Taiwan and Mexico were much lower than Japan’s, while Taiwan’s wages were about twice those of Mexico. However, between 1960 and the mid-1980s, Taiwan’s wages were lower than Mexico’s. In 1960, Taiwan’s wages were just about one quarter of Mexico’s wages, and even Japan’s wages were lower than Mexico’s. Not until the mid-1980s did Taiwan’s wages exceed those of Mexico.
So why were Taiwan’s wages so low during the period 1960-1970? Why did Taiwan’s wages exceed Mexico’s in the mid-1980s? Wages reflect the degree of economic development in a country. Before any answer can be given to the above questions, the relationship between wages and income level and how the income level affects life should be clarified.
2. Taiwan’s Economy: Past and Present
The two major sources of family income are salary income and asset income. The latter refers to interest, dividends, and rental income. For a college graduate who just begins working, the major income source may be his/her salary. If he/she lives frugally, soon he/she will accumulate some savings in a bank, which brings in a little interest revenue every year.
Per capita national income, or “national income per capita” in economics, is determined by dividing the total family income of Taiwan by the total population. Another common term is “Gross Domestic Product” (or GDP per capita). For most countries, these two numbers are very close; thus, the following illustration will not distinguish between the two terms. In 2016, the GDP per capita of Taiwan was about NT$750,000, which is equal to NT$63,000 per month. In contrast, the average monthly salary of a new graduate who just started working was about NT$30,000 in 2016.
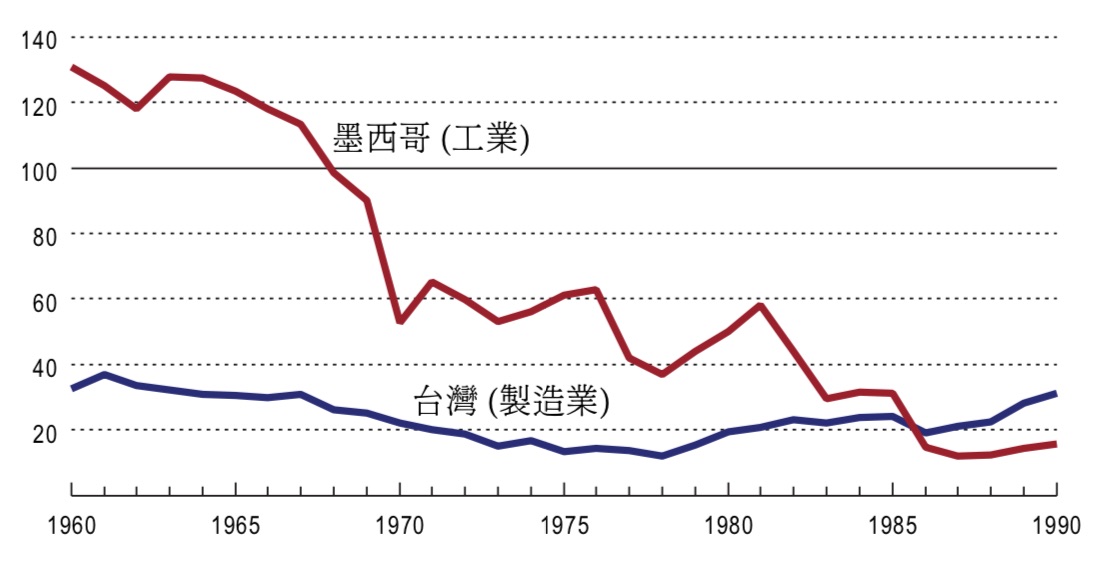
Graph 1: Ratio of the Wages of Mexico and Taiwan against Japan’s (manufacturing industry)
Illustration: Japan’s wages equal 100, starting from 1975, citing Zamora and Kirchmer (2010). During the period 1960-1974, Taiwan’s wages were the average daily income of the manufacturing industry (both men and women). The raw data for Mexico’s are from the nominal wage index (1955 = 100). The graph calculates the nominal wage index of the period 1960-1975 with the wages of 1976. During this period, a fixed exchange rate of 12.5 is used between the currency exchange of the Mexican peso and the US dollar. Data source: Toshiyuki Mizoguchi, Asian Historical Statistics: Taiwan (2008). Chart 3.12: Mitchell, Mexico (2007, p. 143)
2.1. Global per capita Income
In order to compare the GNI (Gross National Income) per capita of individual countries, the United Nations implemented the “International Comparison Program” in 2005. Previously, comparisons of GNI were undertaken through currency exchange. However, exchange rates fluctuate widely, and the exchange rate conversion cannot accurately reflect the purchasing power of a currency. For example, the GDP per capita of Taiwan was about NT$750,000 in 2016, and the exchange rate of the New Taiwan Dollar to the US Dollar was about 30 to 1. Thus, the GDP per capita of Taiwan was about US$20,500. The GDP per capita of the United States in the same year was about US$58,000. Thus, the GDP per capita of Taiwan was about 43% of that of the United States.
But with regards to general consumer goods, the average price in Taiwan was lower than that of the United States. Take restaurant consumption as an example. The amount spent per person in a medium-priced restaurant averages about NT$300 in Taiwan, while it could be US$16 in the US. In other words, the food purchased at a cost of NT$300 (about US$10) in Taiwan requires US$16 in the US. In economic terms, the purchasing power of the New Taiwan Dollar is higher than its exchange rate conversion.
The “International Comparison Program” implemented in 2005 included a nation’s purchasing power as a factor when calculating its GDP per capita, and inserted the letters “PPP” after GDP per capita, as “GDP per capita (PPP).” According to the numbers released by the IMF, the GDP per capita (PPP) of Taiwan in 2016 was ranked No. 19 in the world, higher than those in Japan, Britain, and France.2 Graph 2 shows the GDP per capita (PPP) of various countries in 2016. The darker the color is, the higher the GDP of the country, and Taiwan is among the highest group.
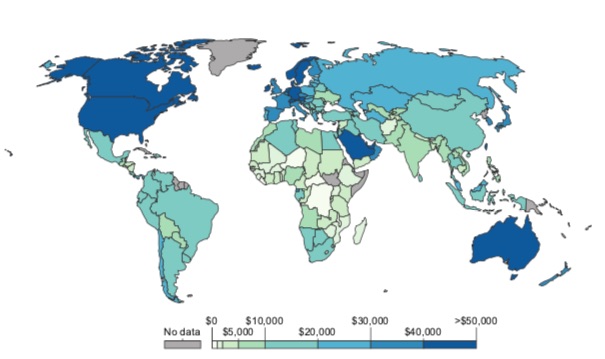
Graph 2: The GDP per capita (PPP) of the World’s Nations in 2016. Source: ourworldindata.org
2.2. Economic Growth and Living Standard
“Economic Growth” refers to the increase of GDP per capita, and “Economic Growth Rate” refers to the rate of increase of GDP per capita. Why is economic growth important? During the 100 years of the 20th century, the growth rate of Taiwan’s GDP per capita was one of the highest in the world. We can thus understand the effects of economic growth on Taiwan from its development over the past 100 years. To understand the effects of the economic growth on Taiwan, we should trace it back to the late 19th century.
During period of Qing rule, Taiwan’s income level was low, characteristic of a traditional agricultural economy. In 1868, when Charles W. Le Gendre arrived in Keelung he noted, “the village has only one narrow street without any drainage ditch, and sewage piled up everywhere3.” Four years later, B. W. Bax, a British, visited the mountain areas in the northern part of Taiwan with Dr. George Leslie MacKay at the end of 1872. They stayed in a hotel in Zhongli, a mid-way point, “it’s relatively clean compared to most hotels run by the Hans.” Dr. MacKay called it “Victoria Hotel” in his diary and said it was the best hotel in northern Taiwan. But when he stayed in the hotel for the first time, “pigs, chickens, and ducks walk around inside the room, and the whole place stinks. There is no mattress and sheets, just a dirty straw mattress4.”
Graph: Dr. George Leslie MacKay stayed in a hotel in Zhongli
In 1895, Taiwan became a colony of Japan. When the Japanese first arrived in Taipei, they found “sewage flows around houses and yards. There are marshes everywhere. Men live with dogs and pigs. Though public outhouses can be seen all over, the toilets are full of feces5.” However, after the economy started to grow in the early years of the Japanese Occupation Era, the living environment of Taiwan greatly improved.
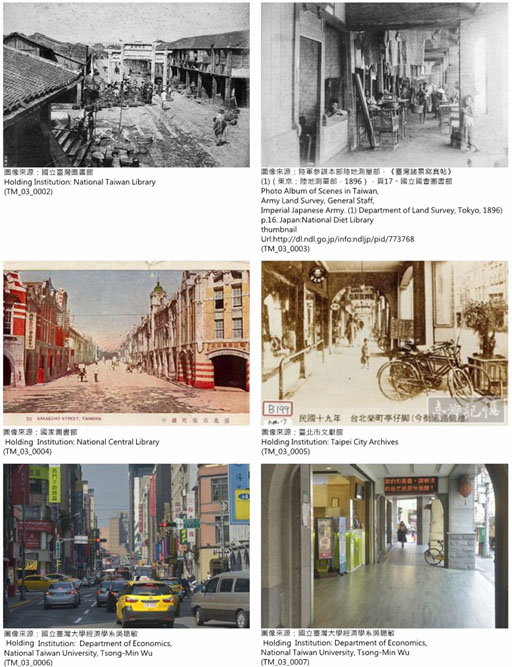
Graph 3: Changes of the Street Scenes of Hengyang Road in Taipei City: from 1895 to the Present
Graph 3 shows the changes of the street scenes of Hengyang Road in Taipei City from 1895 to 2018. The upper left photo and the upper right photo are seen at the end of 1895. The stone arch in the photo was called “Ji-gong Hao-yi Fan” (Arch of Enthusiasm for Public Interests and Justice), originally situated at the intersection of what are today’s Huaining Street and Hengyang Road, but was later moved to the 228 Peace Memorial Park. The street in the photo was called Shi-fang Street, which is the eastern section of Hengyang Road today, and the western section of Hengyang Road was called Xi-men Street at the time. At the far end of the photo is the old West Gate of Taipei (no longer extant). It is clear that the picture was taken from the 228 Peace Memorial Park toward the west.6
Going westward from the stone arch (toward the West Gate), the next intersection was Chongqing South Road. The middle left photo in Graph 3 shows the street scene at the intersection of Chongqing South Road. Street scenes in Taiwan vary widely between 1895 and 1915 because of economic development. During the Japanese Occupation Period, this area was called “Rong Ding” (Prosperous Path), indicating that this was one of the most prosperous districts in Taipei. The center right photo shows shops (with arcades) in Rong Ding in 1930.
Proceeding westward from the intersection of Chongqing South Road, the next intersection is Bo-ai Road. In 1932, Kikumoto Hykkaten, Taipei’s first department store, was situated at the intersection of Hengyang Road and Boai Road. The bottom left photo of Graph 3 shows the current intersection of Chongqing South Road and Hengyang Road (2018). The bottom right photo shows the stores on Hengyang Road. The three sets of photos in Graph 3 show the changes Taipei had undergone during a period of about 120 years since 1895. Taiwan’s society has gone through countless changes since the beginning of the Japanese Occupation Period. Sanitary conditions have greatly improved and the living standard is much higher: these are the results of economic growth.
Many people may think that after 100 years of development, any other country would have gone through the changes Taiwan did in terms of improved sanitary conditions and higher living standards. But that is not true. If you have a chance to visit any number of African countries that continue to lag behind in economic growth, you will experience a gap between them and Taiwan. Actually at the end of the 19th century, the level of economic development of Taiwan was roughly the same as these countries today. In other words, the economic development of Taiwan in the 20th century greatly exceeded that of most countries.
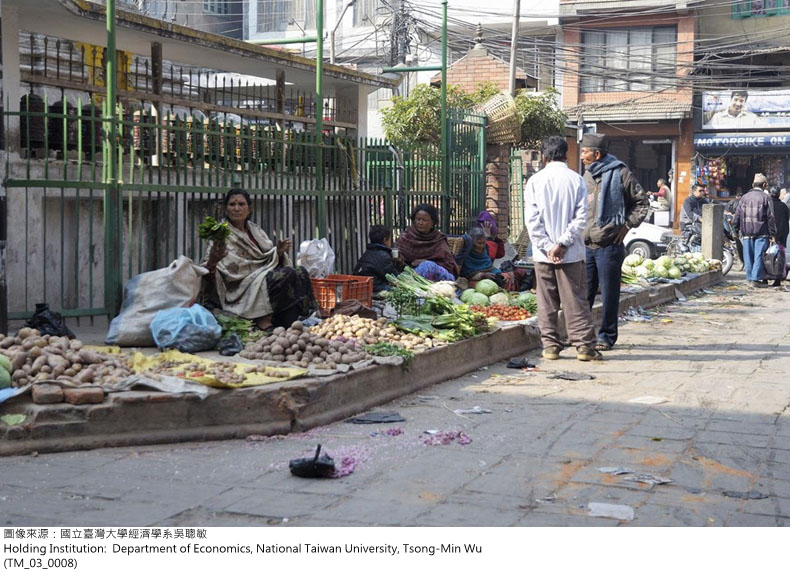
Graph 4: Kathmandu City Downtown (2009)
Graph 4 shows images of street vendors selling vegetables every morning in downtown Kathmandu, the capital city of Nepal. Statistics reveal that the average income level of Taiwan and Nepal were about the same at the beginning of the 20th century. However, Nepal’s GDP per capita in 2008 was about the same as Taiwan’s in the late 1920s. Taiwan began its economic growth in the beginning of the Japanese Occupation Period, while Nepal’s economy suffered long-term stagnation, so the gap of per capita GDP between the two countries has become increasingly large.
2.3. Taiwan and Fujian: 1895
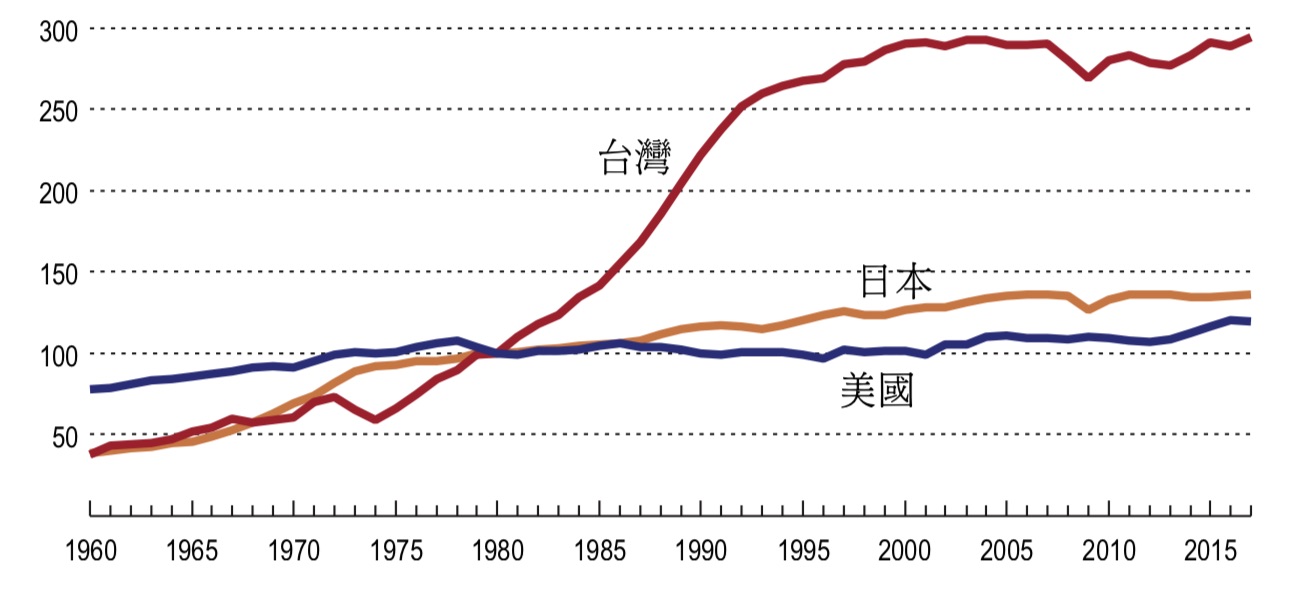
Graph 5 shows the long-term changes for Taiwan and five other countries between 1905 and 2010. There are few reliable statistics for China for the early years of the period, but economists estimate that Taiwan’s income level was about the same as Fujian’s at the end of Qing rule based on the following reason: people in Fujian would come to Taiwan to earn a living if Taiwan’s income level exceeded Fujian’s, and the income level of the two would eventually be comparable with the population movement to and fro.
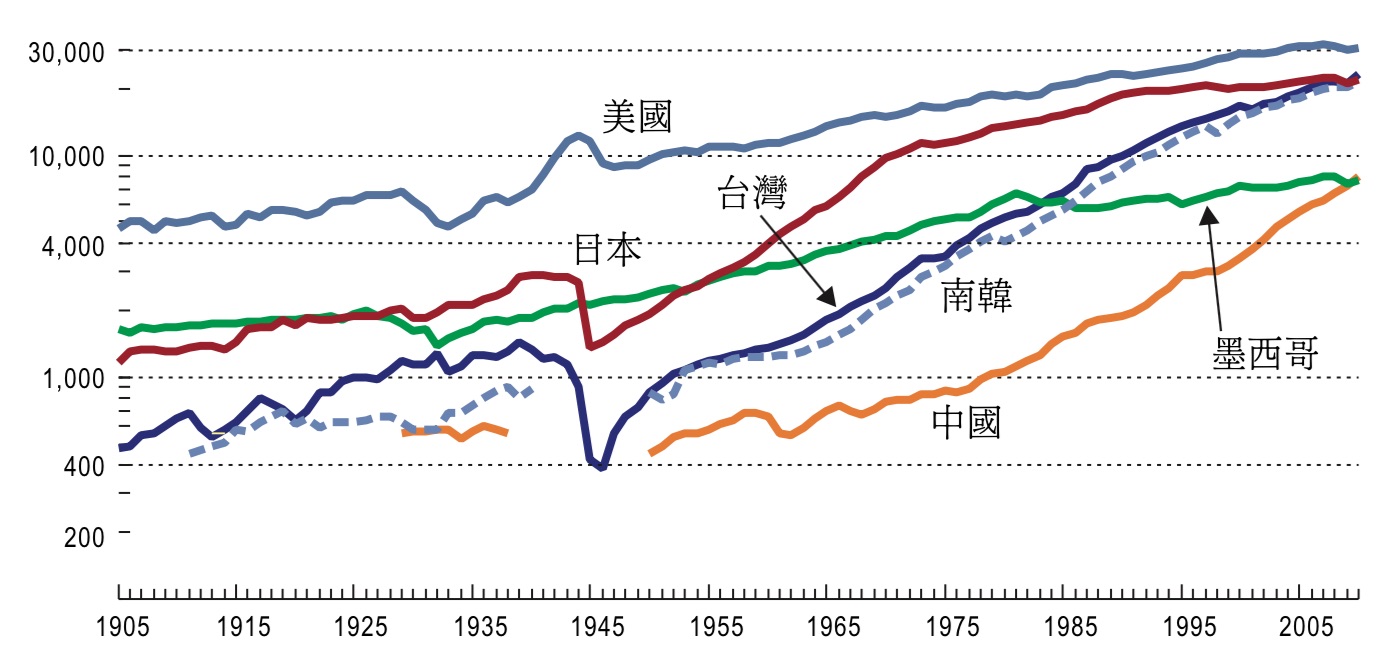
Graph 5: Changes of Income Levels
The graph shows GDP per capita. Unit: 1990 international dollar. Source of information: Taiwan 1905-1950 by Wu Tsong-min (2017a), and Maddison (2013).
Taiwan became a Japanese colony in 1895. The Office of the Governor-General of Taiwan chose May 8, 1897 as “Residents’ Decision Day.” Residents of Taiwan could choose to stay in Taiwan or return to China.7 According to available statistics, less than 0.3% of Taiwanese residents chose to return to China. Imagine the case of two brothers. In 1897 their family income level was the same. But the elder brother decided to return to Fujian in 1897, while the younger brother stayed in Taiwan. Graph 5 shows that in 1938 the average income level of the younger brother’s family who stayed in Taiwan was 2.3 times of that of the elder brother who had returned to Fujian, and in 1980, the average income level of the younger brother’s family rose to about 5 times that of the elder brother’s.
The two brothers might be of comparable intelligence; actually, the elder brother might have even worked a little harder than the younger brother. So why is it that the average income level of the family of the younger brother who chose to stay in Taiwan would become so much higher than that of the elder brother who chose to return to Fujian?
Infrastructure and the change of political systems are the main reasons for Taiwan’s economic growth during the Japanese Occupation Period. Economists believe that the main reasons for the economic development in the beginning of the Japanese Occupation Period were the construction of infrastructure and the change of systems. At the end of 212 years of the Qing rule of Taiwan, Taiwan’s economic system was the same as Fujian’s. In the beginning of the Japanese Occupation Period, the Office of the Director General launched infrastructure projects and systemic reform. For example, the Western Line (Railway) first underwent construction in 1898, and the line opened in 1907. The dredging of Keelung Harbor and Kaohsiung Harbor, moreover, further decreased the transportation costs for the island and Japan and the trading volume of the two places thus increased substantially.
As for systemic reform, the Office of Director-General of Taiwan started a survey of the land in 1898. When it was completed in 1905, a modernized land property system was established in Taiwan. Other important reforms include: establishing a modern legal system and financial system, as well as improvement of the social order.
3. Four Asian Dragons
The countries shown in Graph 5 have different economic growth tracks. At the beginning of the Japanese Occupation Period, Taiwan’s GDP per capita was much lower than those of the US, Japan, or Mexico. The economic growth rate of Taiwan was not low during the period, and Taiwan’s GDP per capita reached a peak in 1938, though it still lagged far behind those of Japan and the US. Unfortunately, after the disruptions of World War II, Taiwan’s income level in 1945 declined to about the same as it was at the beginning of the period. Japan’s income level also greatly declined by 1945.
Both Taiwan and Japan bounced back soon after World War II, but the post-war economic recovery of Taiwan was not directly linked to the period of high growth which began in 1960. Taiwan’s income level was low in 1960, about 41% of Japan’s, 42.9% of Mexico’s, and 18% of Britain’s.8 But between 1960 and 2010, Taiwan’s average economic rate was far higher than Japan’s and Britain’s. Taiwan’s GDP per capita was higher than Japan’s and Britain’s in 2010.
So, is this because Taiwan’s economic growth was particularly high, or because Japan’s and Britain’s economic growth were particularly low? Graph 5 shows the GDP per capita of only six countries. If we compare this performance with that of other countries in the world, the former seems to be the answer. In fact, not only was Taiwan’s economic growth particularly high, the growth rate of Taiwan’s GDP per capita between 1960 and 2000 ranked number one in the world. Besides Taiwan, the growth rates of Hong Kong, South Korea, and Singapore were also high, and the four regions were thus called the “Four Asian Dragons.”
Some scholars referred to the continuous high growth rate of the Four Asian Dragons as “an economic miracle,” implying that such continuous high growth rates had not been seen in prior human history. For Taiwanese people, the economic miracle meant a rapid improvement of their living standard during the period 1960--2000. One can easily see this by comparing the social changes of Taiwan, Mexico, and Philippines.
What brought about the economic miracle of the Four Asian Dragons? Economists searched for an answer. Governmental officials wanted to know if the growth pattern of the Four Asian Dragons could be duplicated.
4. Economy during the War
Between 1945 when Taiwan was devastated by World War II and 1960 when its economy started to enjoy rapid growth, Taiwan went through a very intricate process. The Nationalist government retreated to Taiwan at the end of 1949, and, when its future was unpredictable in the face of an impending attack by Chinese Communists in the early 1950s, the Nationalist government launched a policy of economic control. In the first few years after the war, Yin Zhong-rong (1903-1963) played a key role in planning and implementing Taiwan’s economic policies. In an article published in February 1952, he contended, “The economy of Taiwan is presently a war-time economy, which is also a controlled economy.9” Yin Zhong-rong believed that the economy could only grow under the control of wartime conditions.
4.1. The Korean War and the U.S. Aid
Taiwan’s economy remained a wartime economy during the 1950s. But prior to that, Taiwan had experienced a wartime economy twice, the first time occurring from 1940 to 1945 when the Office of Director-General in Taiwan faced World War II. The second time Taiwan’s economy became a wartime controlled economy was when Japan surrendered after being defeated and the Nationalist government took over Taiwan in August 1945. But this time the war was not World War II, but the Chinese Civil War between the KMT Party and the Chinese Communist Party.
The second period of economic control brought about disastrous results: During 1945-1950, hyperinflation plagued Taiwan. Commodity prices went up 9,000 times in Taiwan between September 1946 and December 194910. To deal with the hyperinflation, the Taiwan Provincial Government announced a program of monetary reform by issuing the New Taiwan Dollar to replace the original currency (which was later referred to as the Old Taiwan Dollar) at the ratio of 40,000 to 1. By the early 1950s, commodity prices in Taiwan gradually stabilized, but not because of the introduction of the New Taiwan Dollar. The true reason was because of the influx of U.S. aid to Taiwan that commenced on June 27, 1950.
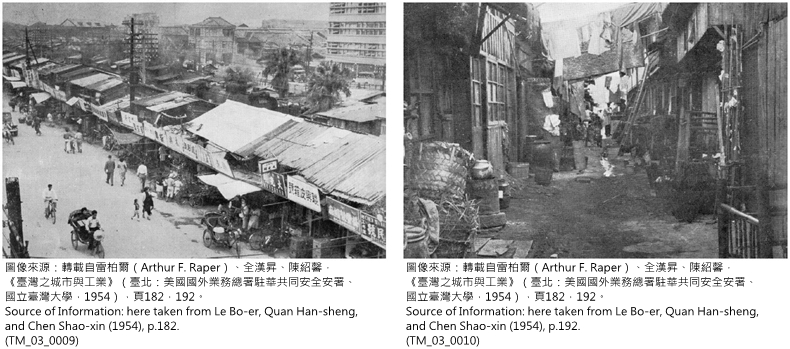
Graph 6: Zhonghua Road of Taipei City in 1953
Source of Information:Arthur F. Raper, Quan Han-sheng, and Chen Shao-xin (1954), p. 182, and p. 192.
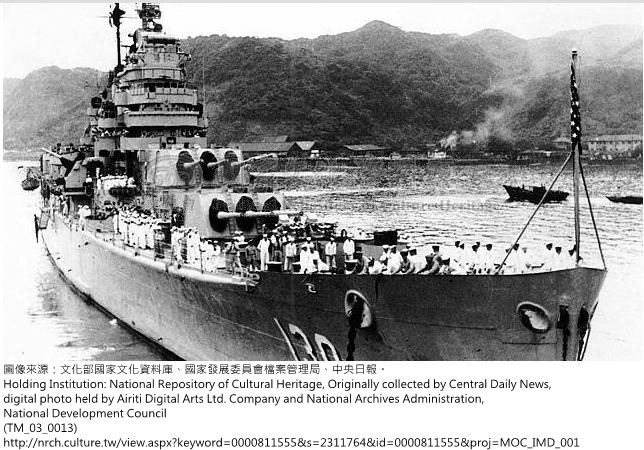
Taiwan was on the brink of destruction in 1950. Mao Ze-dong planned to attack Taiwan, and the intelligence agencies of the US and Britain estimated that without foreign air support, Taiwan would not be able to resist a Communist invasion. Fortunately, a change in the international situation saved Taiwan. On June 25, 1950, North Korea invaded South Korea by crossing the 38th Parallel. In July 1950, a report of the British Consulate at Tamsui stated that the outbreak of the Korean War was like Taiwan’s “Deus ex Machina.” On June 27, 1960, US President Truman announced that the Pacific region and the US Forces in the area would be seriously threatened if the Chinese Communists were to take over Taiwan; the US therefore deployed the Seventh Fleet to the Taiwan Strait to prevent China from invading Taiwan11. Under US protection, Taiwan was spared an invasion of Chinese Communists.
The direct economic impact of American Aid removed the pressure of inflation. The hyperinflation of Taiwan during the period 1945-1950 was caused by fiscal deficits. When the Nationalist Government remained in China, it needed resources to continue its efforts in the Civil War. The Nationalist Government channeled Taiwan’s resources through government-owned businesses and the Taiwan Provincial Government to the Mainland. However, Taiwan had limited resources since it was still on the road to economic recovery, so the Bank of Taiwan was forced to issue the new currency to cope with the financial strains.12
In the beginning of the 1950s, with the government facing the threat of invasion by the Communists, almost all of Taiwan’s resources went into national defense, and as a result, the fiscal deficit and inflationary pressure significantly increased. The monetary reform (the issuance of New Taiwan Dollar) of June 1949 could not possibly decrease the fiscal deficit or reduce inflationary pressure. After the outbreak of the Korean War, the military and economic aid of the US came like a timely rain to ease Taiwan’s fiscal constraints. The Bank of Taiwan gradually gained control over the currency, and commodity prices thus became stabilized.
With American Aid, Taiwan’s security was secured and commodity prices gradually stabilized. But the question of how to develop Taiwan’s economy remained problematic. When the Nationalist Government retreated to Taiwan at the end of 1949, about one million people came along with it, and more than half of them were soldiers. Taiwan’s population immediately grew about 14%. In 1960, a report on Taiwan by the British Consulate estimated that the annual increase of Taiwan’s population was as high as 3.5%, and its demand for food likewise increased. As a result, Taiwan’s agricultural exports were limited, and its foreign exchange earnings thus decreased.13
During the 1950s, Taiwan’s economy was still in the recovery stage, and with its substantial increase in population, Taiwan became a relatively poor country. The photo on the left in Graph 6 shows a scene around some railroad tracks on Zhonghua Road in Taipei City in 1953. The railway was not underground at the time, and to the east of Zhonghua Road a boulevard can be seen. In 1949, when many people were moving into Taipei, the Taipei City Government built booths on both sides along the railroad tracks for vendors to display their merchandize. Later these booths became housing for residents.14 The photo on the right of Graph 6 shows scenes to the east of the railroad tracks between the two rows of booth housing.
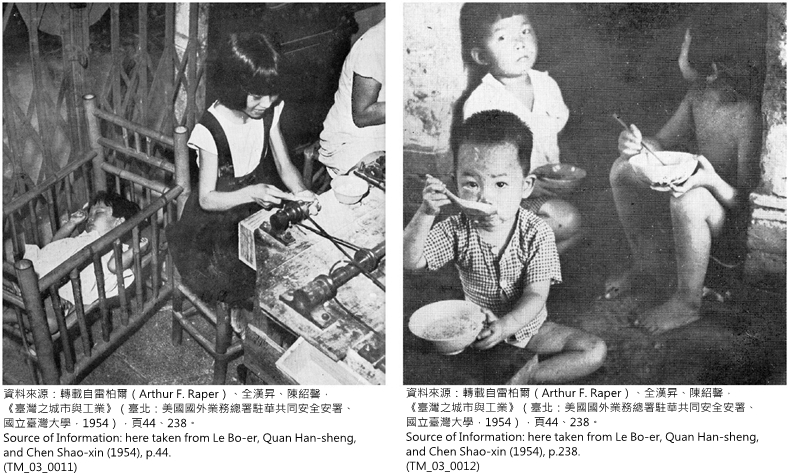
Graph 7: Taiwan in the beginning of the 1950s
Source of Information: Le Bo-er, Quan Han-sheng, and Chen Shao-xin (1954), p. 44, and p. 238.
Graph 7 shows the life of Taiwanese people in the early 1950s during which time Taiwan’s income level was low and employment opportunities were few. Even with job opportunities, child labor was a necessity. As Le Bo-er, Quan Han-sheng, and Chen Shao-sin (1954) pointed out, “In some private businesses, especially factories with old facilities, there were many boy and girl workers.” (p. 26) “Making gruel instead of rice can cut down on rice consumption. Many parents thought it hard to provide enough food for the whole family.” (p. 28)
4.2. Economic Independence
In the 1950s, besides the threat of invasion by the Chinese Communists, Taiwan went through unprecedented changes in its the external economic environment. Its prospects for economic growth were uncertain. In 1954, Yin Zhong-rong (1954, p. 36), in his report to the Economic Committee of the Legislative Yuan, pointed out that the reasons for the difficult situation of Taiwan’s economy included its lack of economic independence and the sharp increase of its population.
“Economic independence” is a relative term, especially when comparing economic conditions before and after 1949. During the Japanese Occupation Period, Taiwan was part of greater Japan’s economy, with rice and sugar as its most important commodities. Almost all of the sugar produced in Taiwan was exported to Japan. Actually, producing sugar in Taiwan did not have any “comparative advantages”, meaning that the cost of producing sugar in Taiwan was higher than it was in other areas. For example, the cost of producing sugar in Java, Indonesia, was much lower than in Taiwan. In general, the cost of producing sugar in Taiwan was twice as much as it was in Java.15 In such a case, why did Japan still buy sugar from Taiwan? It was because Japan imposed a high tariff on sugar imported from Java in order to develop the sugar industry in Taiwan. The price of sugar from Java was higher than that of sugar from Taiwan after the tariff was imposed. One can say that Taiwan’s sugar industry during the Japanese Occupation Period was developed under protectionism.
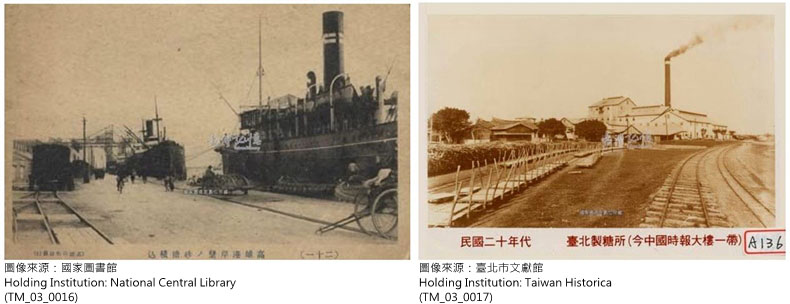
In 1945, when Japan surrendered after being defeated, Taiwan’s economy was no longer linked to economy of the Japanese empire. During the years 1945-1949, Taiwan’s sugar was exported to Mainland China. But starting from 1950 it could only be exported to other countries. Exporting to Japan was still possible, but it had to compete with the sugar produced in other countries. The problem was that the cost of production of Taiwan’s sugar was higher than that of other countries; it had no competitive advantage.
During the Japanese Occupation Period, all of the newly built sugar factories were private owned. After the Nationalist Government took over Taiwan, it established the Taiwan Sugar Cooperation, owned by the government. If the sugar industry had remained in private hands after 1945, the production of sugar would have been drastically decreased as Taiwan itself had a low rate of sugar consumption. Sugar exports were unprofitable and a drain on the overall economy.16 However, protected by the government, the Taiwan Sugar Cooperation continued to produce and export a great quantity of sugar. Why?
In the early 1950s Taiwan suffered a trade deficit every year; that is, Taiwan’s imports far exceeded exports, so it was seriously short of foreign currency. Yin Zhong-rong said in 1952, “Presently the core of the economic problem in Taiwan is to fight for foreign currency17.” In the first few years after the war, sugar exports were the major source of Taiwan’s foreign currency. So sugar had to be exported even though it meant losing money. In 1950, Taiwan’s top three export commodities were sugar, rice, and tea. Only by gaining foreign currency, could Taiwan buy imported goods from abroad. In 1950, the major imported goods of Taiwan were: textile products, synthetic fertilizers, ores, metals and metallic products, in addition to oil.
4.3. Import Substitution Policy
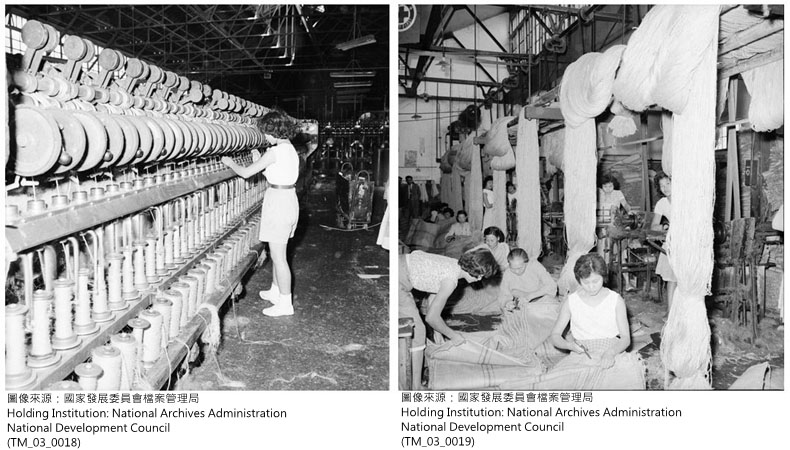
How was the problem of the foreign exchange deficit to be resolved? Yin Zhong-rong proposed the twin policy of “broadening sources of income and reducing expenditures.” “Broadening sources of income” meant to increase exports, and “reducing expenditures” meant to decrease imports.18 In order to broaden the sources of income, Taiwan continued to export sugar, though it was a losing business. How was it possible to decrease imports? In 1950, the number one import in Taiwan was textiles. To decrease the import of textiles would decrease the outflow of foreign reserves. Textile included yarns, fabrics, and garments. Yin Zhong-rong promoted the policy “importing fabric is not as good as importing yarn, and importing yarn is not as good as importing cotton.” This was the highly regarded import substitution policy in the first few years after the war.19
During the Japanese Occupation Period, Taiwan’s textile industry was small in scale, so it had to import textile products from Japan. With the influx of one million people from the Mainland into Taiwan in 1950, the demand for fabrics and garments increased, and textile imports likewise increased. But under the import substitute policy, starting from May 1950 the Taiwan Production Management Commission imposed a high tariff on imported textile products or imposed a ban on their importation. Under the import substitution policy, the importation of cotton yarn, fabrics, and garments greatly decreased, while cotton imports increased. According to statistics, the import of cotton goods took up 8.07% of the total imports for 1951, but it decreased to 0.69% in 1954.20 Taiwan does not produce cotton, so the cotton needed for yarn manufacturing had to be imported from abroad.
The new textiles policy soon accomplished its aim, but another problem appeared immediately. The cotton goods market became saturated in 195221. Taiwan’s market was limited in scale, so the textile industry wanted to exploit foreign markets. If the textile products could be exported to earn foreign currency, it would certainly become a “broadening source of income.” However, the prices of Taiwan’s textile products were too high in the international market of the early 1950s, so exports were not competitive. In the 1950s, the technical level of Taiwan’s textile industry was not high, so it seemed reasonable that textile products would remain uncompetitive in the international market. As a matter of fact, Taiwan’s textile exports were more affected by exchange rates than with technical issues related to the production of textiles.
Both “broadening sources of income” and “reducing expenditures” had much to do with the exchange rate. The cotton needed by the yarn manufacturing industry was imported from the US. If the exchange rate of the New Taiwan dollar to the US dollar was 20 to 1, this meant that yarn manufacturers needed to pay NT$20 for cotton that cost US$1. If the exchange rate was 30 to 1, this meant that yarn manufacturers needed to pay NT$30 for cotton that cost US$1. For yarn manufacturers, an exchange rate of 20 to 1 was much more advantageous.
If the exchange rate dropped from 20 to 1 to 30 to 1 (depreciation of New Taiwan dollar), governmental officials had another problem to worry about. In the early 1950s, Taiwan was still suffering from hyperinflation. If the New Taiwan dollar were to depreciate in value, the prices for imported raw materials and goods would rise accordingly, and governmental officials would be forced to deal with another inflationary crisis. Thus, the goal of the policy for the exchange rate was to prevent the New Taiwan dollar from depreciating. But this would bring about another problem in turn.
Though the low exchange rate of the New Taiwan dollar was advantageous to yarn manufacturers, it made Taiwan’s products for export lose their competitiveness in the international market. For example, if the Taiwan Sugar Corporation produced NT$100 worth of sugar and the exchange rate was NT$20 to US$1, the price of the sugar in the international market would be US$5. In contrast, if the exchange rate was 30 to 1, the price of the sugar in the international market would be US$3.33. It is obvious that the depreciation of the New Taiwan dollar would make Taiwan’s exports more competitive in the international market. Thus, Taiwan’s export would suffer if the exchange rate remained at 20 to 1. Taiwan would have no foreign exchange earnings if its products could not be exported to other countries, and the goal of “broadening sources of income” would not be fulfilled.
In terms of “reducing expenditures and preventing inflation,” the New Taiwan dollar should not have depreciated. But from the aspect of “broadening sources of income,” depreciation of the New Taiwan dollar was more advantageous for the export industry. At the time of the currency reform in June 1949, the exchange rate of the New Taiwan dollar to the US dollar was set at 5 to 1. Between the pulling and pushing of the two forces, the New Taiwan dollar depreciated gradually, but a multiple exchange rate system was developed: different importers and exporters applied different exchange rates. For example, in March 1955 the exchange rate for the export of sugar and rice was 15.55, while for bananas (private enterprises) it was 18.60. As for imports, the exchange rate for US Aid materials (such as cotton) was 18.78, while for private importers it was 24.78.22
Private enterprises could not hold foreign currency at this time. If a trader earned US$1 in exporting bananas, he would have to exchange it to NT$18.60 at the Bank of Taiwan according to regulations. Likewise, if an importer wanted to import foreign merchandise, he would have to get US dollars from the Bank of Taiwan at the exchange rate of NT$24.78 to US$1. Under governmental control, the exchange rate for importing was higher than that of exporting in order to decrease imports and save foreign exchange disbursements. However, black marketeering remained outside governmental control. In March 1955, the exchange rate on the black market was 35.78 to 1.
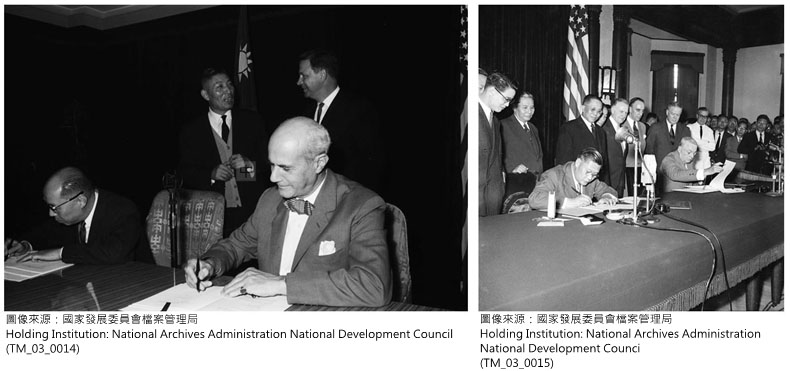
The multiple exchange rate system was implemented in April 1951, but it became more and more complicated over time. In April 1958, however, the control policy was reversed. Yin Zhong-rong now promoted the reform of foreign exchange and trade management. The main direction was the simplification of the exchange rate by adjusting the official exchange rate to the level of the market. Moreover, he also promoted the policies of encouraging exports, including simplifying the export rebate procedure, and eliminating the harbor service charge for exporters.23
In hindsight, the reform helped foster the export of Taiwanese textiles and led Taiwan along the path of high growth. The example given by Wu Zong-min (2016, Chart 1) explains why the above reform facilitated the export of textiles. In June 1953, the exchange rate of the NT dollar to the US dollar was 15 to 6. If Taiwan’s cotton yarn was exported and sold in the New York market, its price would be US$0.7 per pound, higher than the value of NT$0.639 in the New York market. So manufacturers refrained from exporting it to avoid losing money.
In 1959, the NT dollar depreciated to 40 to 1, and the export tax rebate was put into practice. The former brought down the prices of Taiwan’s products in the international market, while the latter lowered costs for exporters. Let us take the yarn manufacturing industry as an example. When manufacturers imported cotton from abroad to produce cotton yarn for export, they did not have to pay a tariff or commodity tax for the imported cotton. Because of the deprecation of the NT dollar and the export tax rebate, the price for Taiwan’s cotton yarn decreased to US$0.541 in the international market. With such a competitive price, the export of textiles became feasible. In 1958, the amount of the export of Taiwanese textiles was US$1.542 million, rising to US$9.982 million in 1959, and US$65.070 million in 1967.24
In April 1958, Yin Zhong-rong instituted the reforms, but in the early 1950s he was the one who had proposed and forcefully implemented governmental control. Why did he change his mind so drastically about reform? In his own words, he explained that when a less developed country faced a huge balance of payment deficit and serious inflation, applying a system of controls was a natural tendency. “But the disadvantages that often accompany such controlling factors also appeared in Taiwan...The advantages of the controls, such as stabilizing prices, encouraging exports, inhibiting consumption, promoting economic development, etc., were undermined by the increasing disadvantages and lost their effectiveness25.” In other words, Yin Zhong-rong believed that the system of controls helped improve the balance of payments and encouraged exports, but the disadvantages of the system soon came to outweigh its advantages.
As a matter of fact, during the entire period when controls were put into place in the 1950s, Taiwan’s balance of payments did not improve, and the prospects for expanding exports were bleak26. Thus, a more realistic description would be: “The system of controls did not bring about the expected advantages.” Yin Zhong-rong changed his mind possibly because as a decision-maker, he realized that the original goals for implementing controls were not being realized. However, a change of policy often entails a shift in values. Before the reform of April 1958, high-ranking KMT officials had had heated arguments about whether to put the new policy into practice. Yin Zhong-rong was in favor of the reform as the director of the Foreign Exchange Trade Review Committee of the Executive Yuan, and the support of Yan Jia-gan, Minister of Finance at the time, played the key factor.27
Scholars’ opinions might also have influenced Yin Zhong-rong in his turnabout. According to the description of Xing Mu-huan (1993), Yin Zhong-rong’s ideas about controls started to change in the early 1950s. Little (1979, pp. 474-75) identified Jiang Shuo-jie and Liu Da-zhong (working at the International Monetary Fund at the time) as two of the most influential scholars.28 However, Scott (1979, pp. 377-78) believed that by such statement, Little might have underestimated the influence of the US Security Branch (American Institute in Taiwan that was responsible for US aid to Taiwan).
5. U.S. Aid and Taiwan’s Economic Development
After the breakout of the Korean War, the United States began providing Taiwan with huge amounts of military and economic aid. Initially, American aid was given to ensure Taiwan would not be taken over by the Chinese Communists. But in the mid-1950s, American aid was earmarked for Taiwan’s economic development.29 How to develop Taiwan’s economy? In the early 1950s the Nationalist Government believed that it was necessary to adopt economic controls, but the Security Branch thought adapting to the market system was necessary. Conflicts brewed as the basic concepts of the two parties were at odds.
Besides debates over the economic system, another even more heated conflict was Chiang Kai-shek’s wholehearted resolve to “recover the mainland” and the diversion of most of the nation’s resources to defense and the military. In January 1960, Yan Jia-gan, Minister of Finance, gave a report on Taiwan’s budget: “currently more than 80% of the budget of the central government goes into military expenditures, and half of the NT$2 billion counterpart fund also goes into military expenditures...Americans think that most of what we get from them is spent on domestic consumption30.” The US disapproved of the Nationalist Government’s intention to launch an attack on Mainland China and demanded that Taiwan reduce its expenditures on national defense and put more resources into economic development.
From the perspective of an independent sovereign state, suggestions of friendly nations could be taken as a frame of reference, while it retains the decision-making power. But American Aid entailed great sums of money, so the policy advice provided by the American Institute that was in charge of American Aid had a definite influence. In 1953, the US sent an economic advisory group to Taiwan to review the financial system and the monetary policy of Taiwan. Concrete policy advice afterwards was published in Report of the American Economic Advisory Group (Chinese version, October 1954).
The report is divided into 5 chapters. The first chapter makes clear that the major obstacle in the development of Taiwan’s economy was the “lack of capital” (2), and one of its suggestions was to attract foreign investors (especially American enterprises) to Taiwan. The report also pointed out that “expanding exports was extremely important to China,” but it should be done by private enterprises. Furthermore, the United States insisted that the Nationalist Government reduce its expenditures on national defense.
The economic group issued the report in the first half of 1954, and the official exchange rate at the time was 15.55. The advisory group suggested that the NT dollar be depreciated to attract foreign investors to Taiwan. It also pointed out that depreciation of the NT dollar would be helpful in expanding exports. (pp.19-20)31 In June 1955, Director Joseph L. Brent of the Security Branch requested that the Nationalist Government issue a report on the progress of its intended reforms based on the suggestions of the advisory group.32 In its response, the Executive Yuan first determined that 84 suggestions were made by the advisory group, which were divided into three categories. The first category consisted of those that were simple and clear and could be put into practice immediately. The second category was made up of those with proper principles and could be implemented gradually in a step-by-step approach. Those in the third category were deemed impracticable at the time.33
The depreciation of the NT dollar suggested by the American Economic Advisory Group was listed in the third category. In other words, the Nationalist Government did not think it was the right time to depreciate the NT dollar. In fact, the NT dollar did depreciate after 1954, but considerations for broadening income sources and cutting down on expenditures as well as reducing inflation led to the development of a complex system of multiple exchange rates.
At the end of the American aid to Taiwan in 1965, Jacoby (1966, p. 138) pointed out in his evaluation that the most important effect of American aid was its contribution to the boom experienced by private enterprises. He also pointed out that the Nationalist Government had not implemented all of the suggestions for reform proposed by the United States. For example, the Security Branch’s suggestions for the Nationalist government to decrease its military expenditures and to implement an accommodative monetary policy were not taken up at all (p. 144). He also contended that the advice for eliminating trade and exchange rate controls given by the American Aid Advisory Group was only partially heeded.
By 1959, it was obvious to see that American aid to Taiwan was coming to an end. In addition, the US’s overall foreign aid policy had been revamped: the total sum of foreign aid was reduced and it went to just a few chosen countries. In November 1959, after Douglas Dillon, Deputy Secretary of State, paid a visit to Taiwan, the US believed it was necessary to increase aid to Taiwan. In the circumstances in which the US was planning to cut down the scale of its foreign aid, Taiwan naturally needed to grasp the chance for continued aid. The Nationalist Government and the Security Branch worked out the details for increasing aid to Taiwan, and the government asked the US to offer suggestions. Haraldson, Director of the Security Branch, proposed eight suggestions, and among them the 4th suggestion was to continue reform of the exchange rate system.34 In January 1960, the Executive Yuan announced the “19 Measures of Financial and Economic Reform Program,” an elaboration of the 8 suggestions proposed by Haraldson.
By examining the eight suggestions by Haraldson in 1960 and the report of the American Economic Advisory Group in 1954, one can see that the US did not change its ideas on how to develop Taiwan’s economy. However, reforms only started to have positive results in the early 1960s. Jacoby (1966, pp. 140-41) believed that, although the reforms initiated in 1958 increased exports effectively, the Nationalist Government still tried to protect the nation’s industrial development by controlling trade and the exchange rate.
Besides the Security Branch of America, several scholars and experts also proposed policy changes in the 1950s, which probably contributed to Taiwan’s reform. However, as Jacoby mentioned (1966, pp. 130-34), the Security Branch of American Aid had huge amounts of resources at its disposal. It could increase or decrease the amount of foreign aid to Taiwan. Thus, its influence on the development of Taiwan’s economic system far exceeded that of any individual or institution.
6. High Economic Growth: 1960-2000
Taiwan’s high growth after the war was driven by the continuous mass export on the part of the private enterprises. It is referred to as “export-oriented economic growth.” Graph 8 shows the percentage of exports for the GDP of Taiwan and Japan, which are compared with those of other countries in the world. Though statistics of the global average in the 1950s are unavailable, the percentage of exports for Taiwan in the 1950s should be lower than the global average. By the early 1960s, this percentage had risen significantly. Compared to statistics shown in Graph 5, Taiwan’s GDP per capita started to rise at this time.
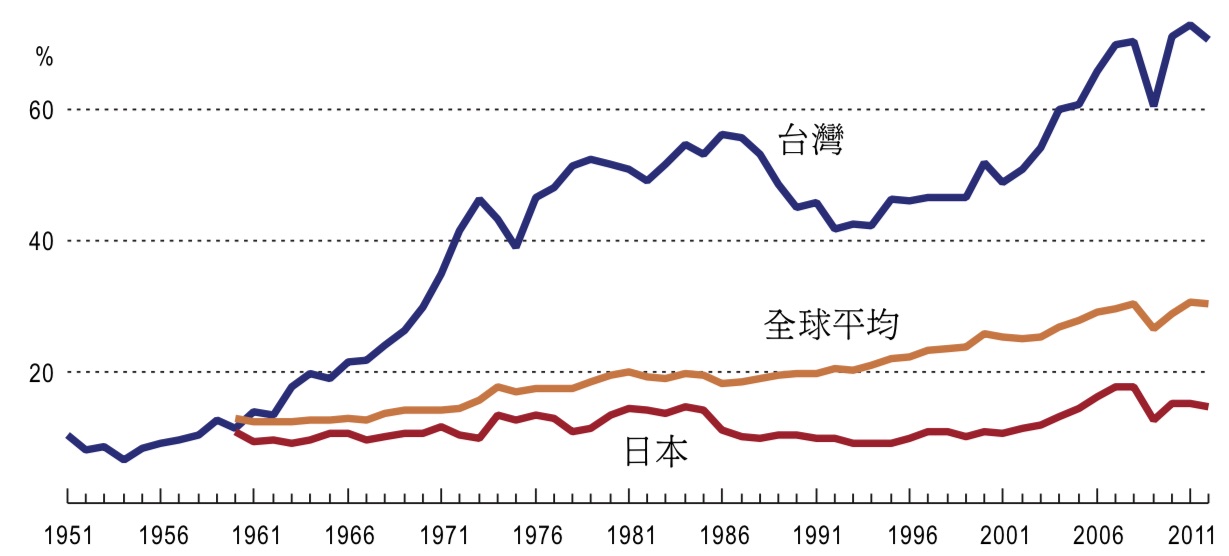
Graph 8: Export-oriented Economic Growth
Percentage of exports in overall GDP, including merchandise and service exports. Source of information: Directorate General of Budget, Accounting and Statistics, the Executive Yuan; World Bank.
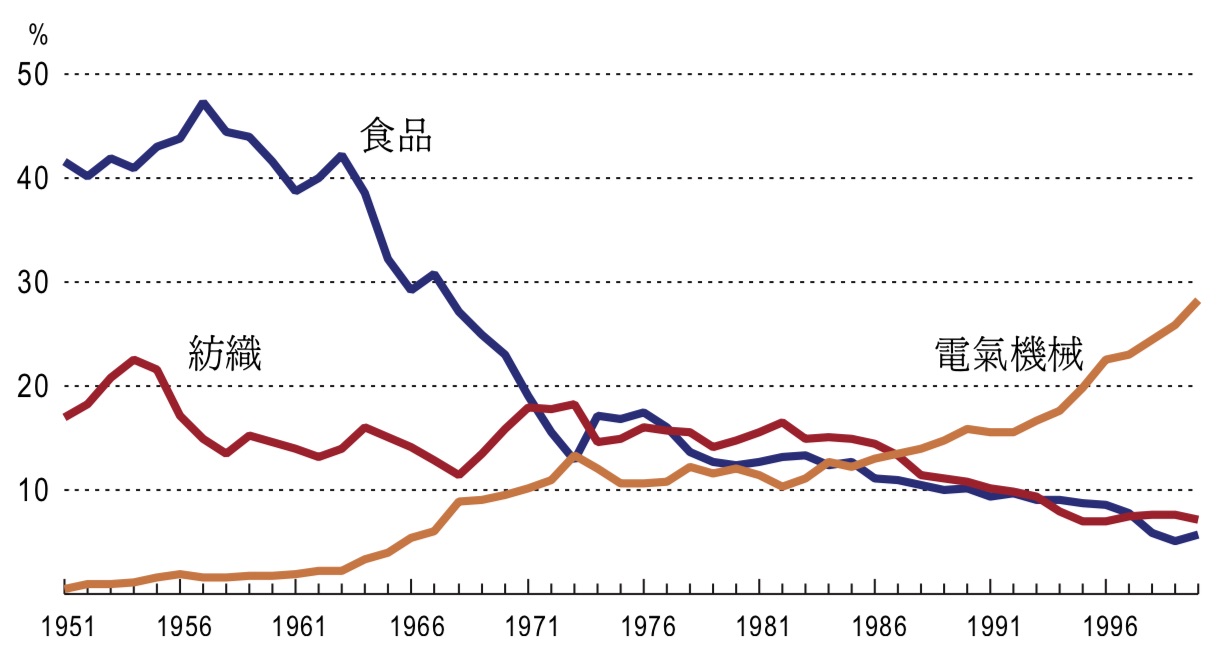
Graph 9: Percentage of the Output Value of Foods, Textiles, and Electrical Machinery in the Manufacturing Industry
“Foods” include foodstuff, drinks, and tobacco; “textiles” include fibers and garments. Source of information: Toshiyuki Mizoguchi (2008), Statistical Chart 5.2, pp. 296-97.
During the period from 1960-1970, Taiwan’s major private exports featured textiles and electronic products. Graph 9 compares the development of the textile industry, the electronics industry, and the food industry, which was the most important industry in the initial post-war period. In the 1950s, the output value of the food industry (mainly sugar) made up the highest percentage of overall revenue, but it started to fall in the 1960s. In fact, the real productivity value of the food industry continued to increase, but at a lower rate than that of the textile industry and the electronics industry. From 1960 to 1980, the productivity value of the food industry increased 348%, whereas the productivity value of the textile industry had a 2,332% increase.
The productivity value (value added) of the textile industry between 1953 and 1955 took up more than 20% of the manufacturing sector. But the textile products during this period were for the domestic market, and the export ratio was low. The export of electrical machinery began in the mid-1960s, and the percentage of its productivity value in the manufacturing sector saw a continuous rise.35 Previously, the productivity value of the textile industry was higher than that of the electronics industry. But since the mid-1980s the productivity value of the electronics industry has exceeded that of the textile industry to become the most important industry in Taiwan. In 2000, the productivity percentage of electrical machinery reached 28.19%, while that of fibers and clothing products declined to 7.21%.
1960 was the year when Taiwan first began the mass export of textile products, which led to high economic growth. In hindsight, one may wonder if the policy of controls on imports in the early 1950s was unnecessary. In other words, if the depreciation of the NT dollar and the reduction of export duties had been put into practice in the early 1950s, growth in the export of textile products might have begun earlier than the 1960s. Economists have different answers to this question.36 However, the experience of the development of the consumer electronics manufacturing industry during the period of 1960-1970 may be helpful in answering this question.
6.1. Consumer Electronics Manufacturing Industry
The development pattern of the electronics industry is quite different from that of the textile industry. The latter was developed by local manufacturers and went through the policy of “import substitute.” In contrast, the beginning of the development of the electronics industry occurred when American and Japanese manufacturers came to Taiwan to set up factories. In the first years after the war, Taiwan had a few electrical manufacturers, but their productivity was limited and products were intended mainly for the domestic consumption of the island.
In the 1950s, some Taiwanese manufacturers started to collaborate with foreign manufacturers. In 1953, Tatung Company signed a number of contracts with Japanese companies to produce electric meters for them. In 1962, Taiwan’s Jian-Long-Hang Company signed a joint venture with Panasonic Japan and established Panasonic Taiwan, at first limited to selling products for the domestic market. The mass export of Taiwan’s electronic products began with parts and components in the mid-1960s; later it included television sets, radios, and other consumer products, with the US as its major export market.
In the post-World-War-II era, televisions were the new high-tech product and the market demand for them was huge, so many American and European manufacturers began producing them. The American TV market faced intense competition. In 1951 there were 97 assembly factories of black-and-white televisions in the US, but by 1960 only 27 survived. In 1968, 18 companies (with 30 factories) in the US produced color televisions, but only 12 companies (with 15 factories) were still operating in 1976. Besides the competition from domestic companies, more intense competition came with the export of Japanese televisions to America.37
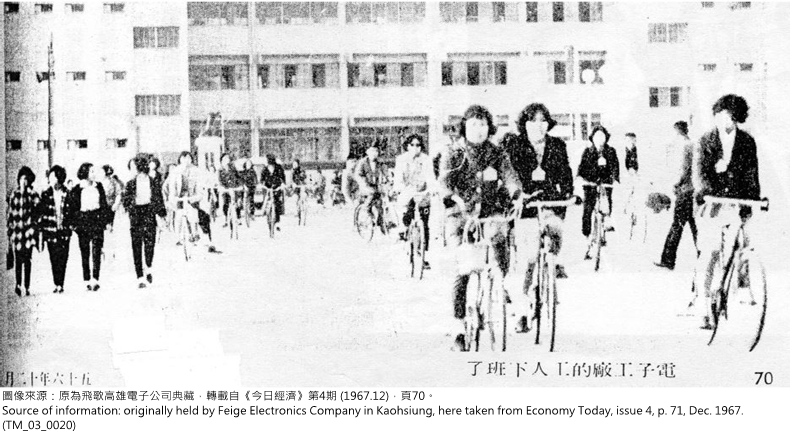
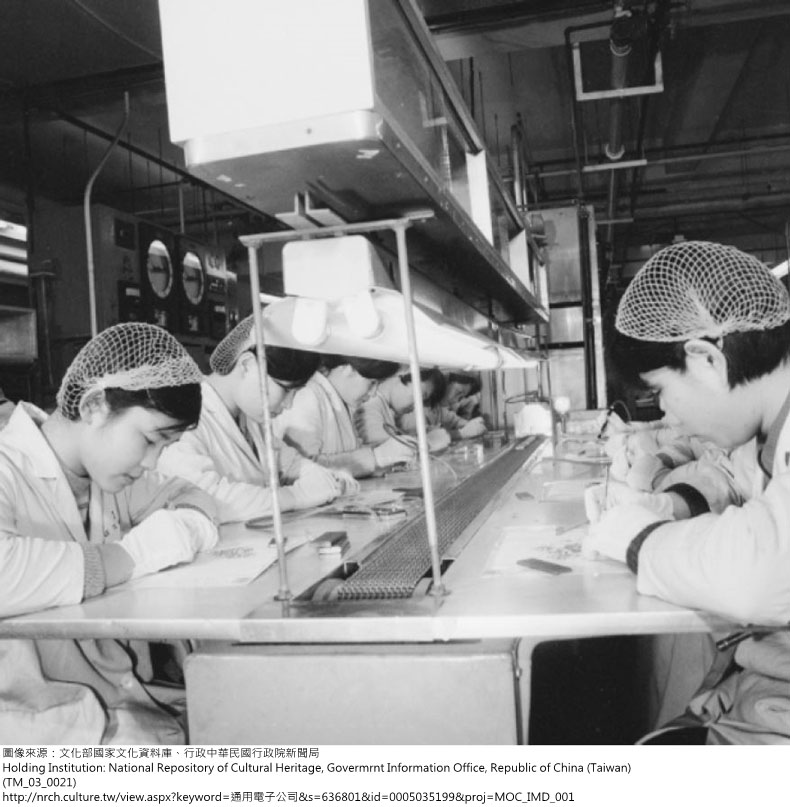
Graph 10: Workers at an Electronic Factory Getting off Work
Economy Today, issue 4, p. 71, Dec. 1967.
The Radio Corporation of America (or RCA) played a key role in the development of television and radio. In 1958, the US Department of Justice required that RCA authorize domestic manufacturers to produce television sets without charge. To maintain a profit, RCA turned to foreign manufacturers who would pay for authorization. From 1960 to 1968, RCA signed 105 contracts for the production of radios and televisions with Japanese manufacturers at different prices. These authorization contracts brought high profits to RCA, but also brought the Japanese electronics manufacturers into the gate of the consumer electronics industry.
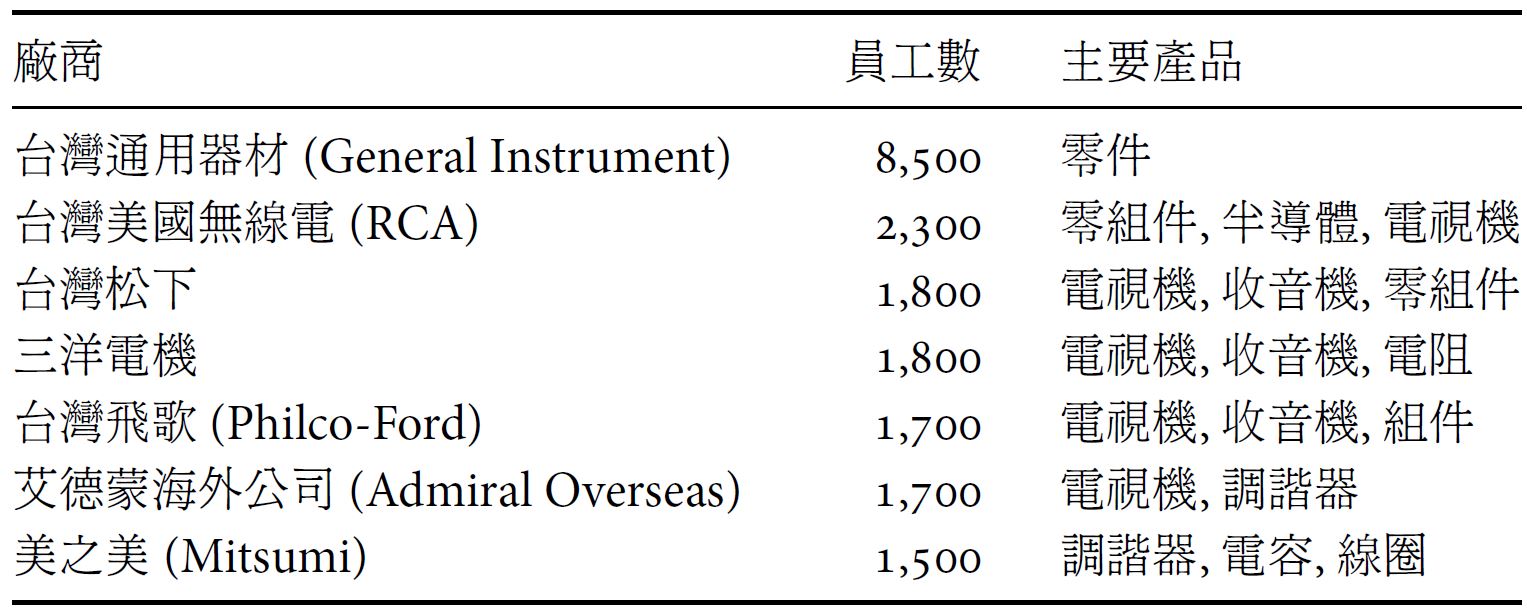
Chart 1: Foreign investment in Taiwan’s electronic industry (the end of 1970)
Source of information: Lin Rong-fang (1972), Chart 5 & Chart 6.
Intense competition forced manufacturers to lower their costs. The production of a traditional television could be divided into three parts: the image tube, components, and assembly. To lower costs, American manufacturers imported components from Japan in the mid-1950s. They soon found that Japanese components were not only cheaper, but also of higher quality. Major television manufacturers in America, such as Admiral and Zenith, started to import components from Japan in 1963. That American television manufacturers would use imported Japanese components put a lot of pressure on US component manufacturers and forced them to look for some other way to lower their costs.
Graph 11: Production Line of General Instrument Taiwan Limited Company, 1970
The production of electronic components and television assembly are both labor-intensive industries, so manufacturers needed to look for countries that paid lower wages. In 1964, General Instruments Taiwan was established in Xindian to produce electronic components. This served as a pioneer case for the big electronics companies of the United States and Japan for the establishment of factories in Taiwan. After undergoing expansion, the company’s staff had increased to 6,800 by September 196838, and 8,500 by the end of 1970. The successful experience of General Instruments Taiwan encouraged more foreign companies to set up factories in Taiwan. Chart 1 shows the major electronics companies based on American and Japanese investment at the end of 1970.
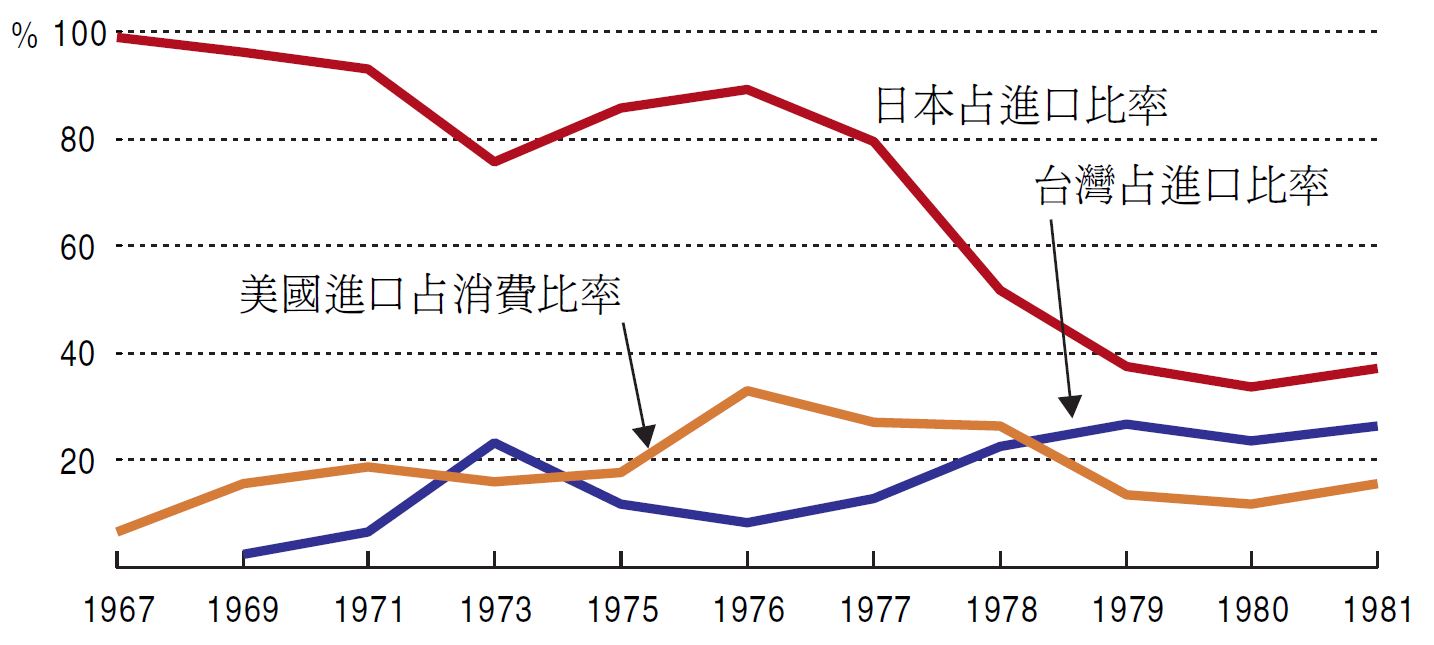
Graph 12: Imported Color Televisions in America
Export quantity. “Percentage of imports from Taiwan” means the percentage of televisions imported from Taiwan of the total number of televisions imported by the US.
Source of information: Office of Technology Assessment (1983), p. 116.
Foreign investment to establish factories in Taiwan might have been intended for the market in Taiwan. However, the economic scale in Taiwan was small, so American companies were not interested in Taiwan’s market. American electronics companies that set up factories in Taiwan imported most of the raw materials from other countries and shipped the assembled products back to the US. It cost less than producing them in the United States.
First limited to the production of components, television sets soon began to be produced in Taiwan and exported to the US. In 1969, Taiwan began exporting color televisions to the US, a total of 22,000. In 1978 the number rose to 624,000. Chart 12 shows the increase in color televisions imported by the United States. From 1967 to 1976, the number of imported color televisions first rose and then fell in the American domestic market, mainly because the American government started to limit imports due to their impact on domestic manufacturers. Beginning in 1979, due to the restrictions on imports imposed by the US, Taiwan’s exports decreased. In 1981, 514,000 televisions were exported to the US. The average annual growth rate can be calculated by taking the number produced in 1969 as year one and the number in 1981 as the final year, making the average annual growing rate during this period 41.9%.
6.2. Domestic Content Rate
When General Instruments Company established factories in Taiwan and began producing components in 1964, all of the component materials were imported. But in order to lower costs, foreign companies began purchasing materials from local companies. This was an opportunity for the development of Taiwan’s component manufacturers. To determine the extent to which foreign companies stimulated the development of local industries, economists need to look at changes in the domestic content rate, which means the percentage of local production in the overall manufactured products.
Many developing countries impose a domestic content rate on foreign companies that establish factories in their countries. Taiwan has also imposed a domestic content rate since 1963 to promote the development of its domestic component industry.39 However, the primary reason that foreign companies established factories in Taiwan was to lower costs. If the quality of local components was poor, foreign companies often incurred increased costs. On the other hand, if the quality of the locally produced components were good and the prices were low, foreign companies certainly would choose to use locally produced components.40
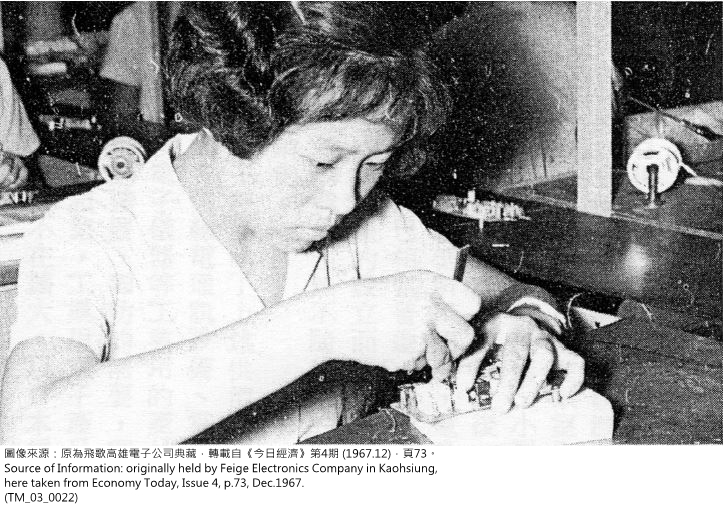
Graph 13: Assembly of Transistor Radios
Source of information: Economy Today, Issue 4, p. 73, Dec. 1967.
According to an investigation by Arthur D. Little, Incorporated (1973b, p. 47) in 1973, among Taiwan’s exports of electronics, the domestic purchase rate of raw materials and components was 37%, the Japanese import rate was 53%, and the American import rate was 10%. The same report also pointed out that a notable weakness in the development of the electronics industry in Taiwan was the components industry. However, Taiwan’s components industry developed along with the overall development of the electronics industry. The year 1977 may serve as an example. In terms of the market for Taiwan’s electronics products, consumer products took up 49.5%, and electronic components took up 43.4%41. Schive (1990, p. 78) analyzed the domestic content rate of foreign companies in Taiwan between 1970 and 1980 and found that the domestic content rate of foreign companies (excluding overseas Chinese investment) was 35.84% in 1972, which increased to more than 50% in 1978.
Graph 14 shows the changes in the domestic content rate for the textiles, garment, and electrical and electronics industries. The above three industries were the most important private export industries in Taiwan in the 1970s. It shows that during the period 1972-1978, the domestic content rate of the garment industry declined, while the domestic content rate of the textiles industry remained about the same, but the domestic content rate of the electrical and electronics industry rose. The development of the electronics component industry must have proved beneficial for the development of consumer electronic products, including the personal computer industry in Taiwan.
7. Comparative Advantages
Arthur D. Little International Inc. (ADL), an American management consulting firm, was commissioned in the early 1970s by the Taiwanese government to evaluate the conditions in establishing factories to produce high-tech products in Taiwan. The report’s conclusion listed a number of comparative advantages of Taiwan, the first being: Taiwan’s labor force was characterized by lower wages, higher productivity, and being easy to train. For example, in the electrical and electronics industry, setting up factories to produce electronics products in Taiwan cost about 60% of what it cost in the US.42
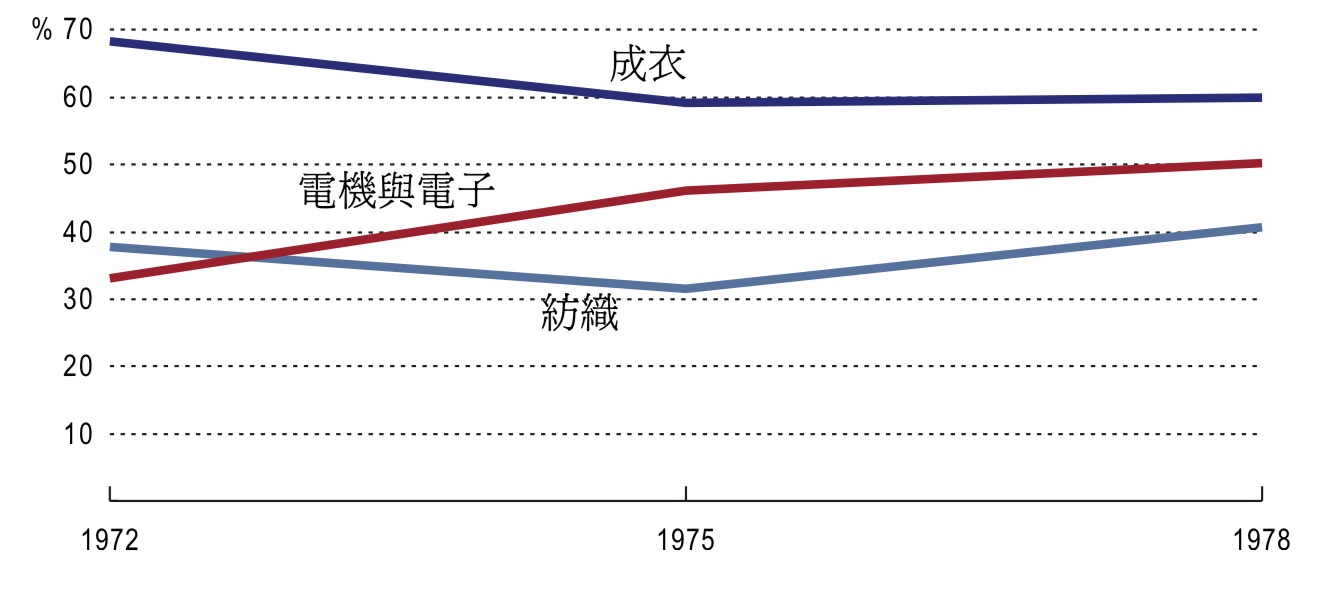
Graph 14: Domestic Content Rate
Foreign companies (excluding those in the export processing zone) between 1975 and 1979. Source of information: Schive (1990), p. 75.
Graph 15: the ratio of wages of the manufacturing industry of various countries compared to those of the United States
US wages are given as 100%. Source of information: https://www.bls.gov/fls/discontinued.htm, Chart 1.1.
7.1. Wages
Graph 15 provides the wages (hourly compensation) of Taiwan, Japan, South Korea, and Mexico and their ratios compared to those of America, which is 100%. In 1975, Taiwan’s wages were 6.27% of America’s, and 13.2% of Japan’s. Hu (1966, p. 30) made observations in Taiwan in the mid-1960s and found that the wages of Taiwan’s female workers were 1/15 of America’s, 1/3 of Japan’s, and 1/2 of Hong Kong’s. Arthur D. Little, Incorporated (1973b, p. 53) undertook an investigation of the wages of female workers in the electronics industry in 1973. It showed that the monthly wages of Japanese female workers ranged from US$195 to US$305, compared to a range from US$35 to US$65 in Taiwan. Wages in South Korea, Hong Kong, and Singapore were all higher than Taiwan’s.
Besides low wages, the quality of labor in Taiwan was high. Hu (1966, p. 30) interviewed the managers of Taiwan’s US-owned factories in the 1960s. He concluded that the amount of time it took for Taiwanese female workers to learn a new operation was only 1/3 of the time for American workers, and the job was better done.43 According to the study of Arthur D. Little, Incorporated (1973b, p. 55) on labor efficiency, Japanese labor had the highest level of efficiency. If Japanese efficiency was 1, Hong Kong’s was 1, America’s was between 0.8 and 0.9, and Taiwan’s was between 0.8 and 1.0.
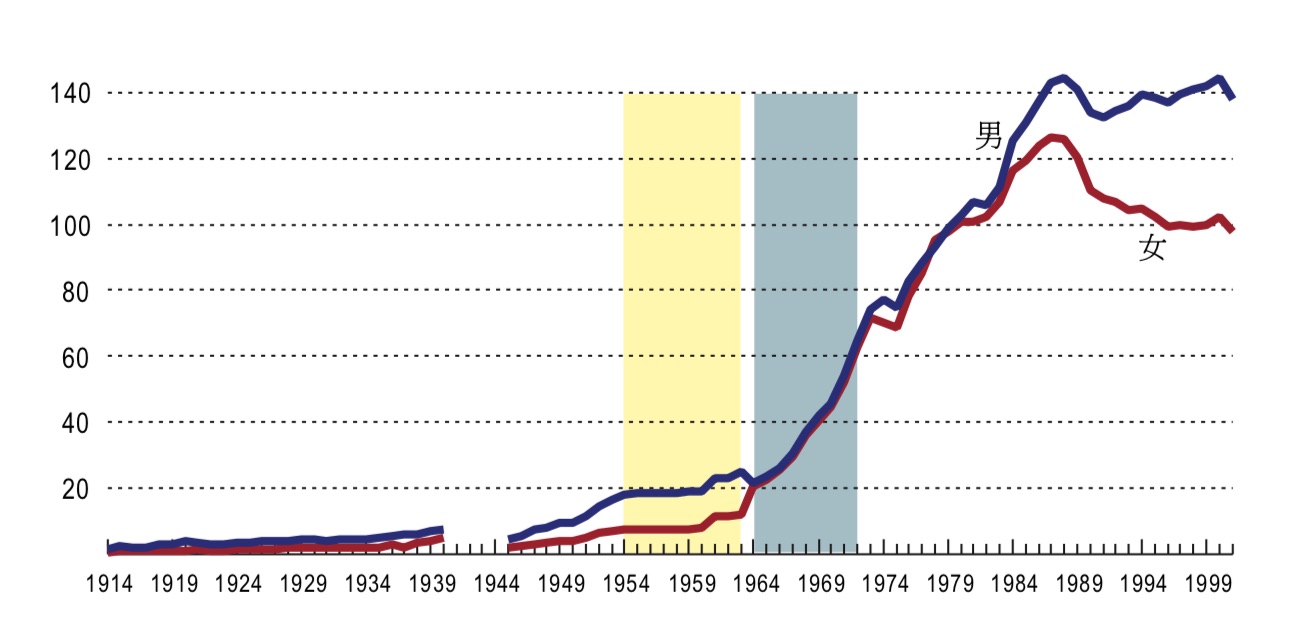
Graph 16: Number of workers employed by Taiwan’s manufacturing industry
Unit or number of employment: 10,000. Source of information, number of workers employed, Toshiyuki Mizoguchi (2008), Chart 2.1 and Chart 3.7. Different statistics agencies were responsible for different stages, and different measures of investigation were taken. Between 1954 and 1963 the agency was Taiwan Province Labor Statistics Report; between 1964 and 1972, the measure was the total numbers of male and female labor in Taiwan Area Labor Statistics Annual Report of the Republic of China, and the Taiwan Province Labor Statistics Report divided the ratio between male and female workers.
During the Japanese Occupation Period, wages in Taiwan for the manufacturing industry was 51% of Japan’s in 1937, but it declined to 32.5% of Japan’s in 1960. Why? One of the factors was the immigration of about one million people from Mainland China in 1951. The mass immigration impacted the labor market. In 1951, the productivity value of Taiwan’s agriculture made up 32.3% of GDP, while its industry made up 21.3%, among which the sugar industry was the most essential as the textiles industry was still at an early stage of development. The production of granulated sugar of the new sugar factories was capital intensive and was unable to absorb much of the new immigrants all at once.
In the early 1950s, with the import substitute policy in place, Taiwan’s textiles industry was being developed, but the domestic market reached a saturation point in 195344. The export of Taiwan’s textiles only began in the early 1960s. In the 1950s, those who could not find jobs in the industry and service sectors could only return to work in rural areas. For example, the number of those employed in agriculture in 1960 was 92,000, more than the figure for 1951. This reflects the situation after the mass immigration, during which those who failed to find jobs in urban areas were forced to work in the agricultural sector.
However, beginning in the early 1960s, the employment market witnessed a marked change. As the private manufacturing industry flourished, the rural population began moving to urban areas. The number of individuals employed in agriculture in 1970 was 55,000, less than the figure for 1960, and the number in 1980 was 36,100 less than that for 1970.45 Graph 16 shows the changes of male and female workers employed by the manufacturing industry. In 1961, the number of female workers in the manufacturing industry increased dramatically, and the textiles industry experienced its highest increase. The number of those employed in electrical and electronics machinery industry also increased significantly in 1963-1964, which reflects the rapid development of the electronics industry.
7.2. Labor-Intensive Industries
After the exchange rate and trade control reform in 1958-1959, the comparative advantages of Taiwan’s low wages started to emerge in the rapid growth in the exportation of textiles and electronics. However, as Graph 9 shows, at the same time that the textiles industry and the electronics industry were experiencing high growth, the food industry went into decline. Each of the three industries focused on export. If the depreciation of the NT dollar was advantageous to the textiles industry and the electronics industry, it should also have been advantageous for the sugar industry. But why did the sugar industry decline instead?
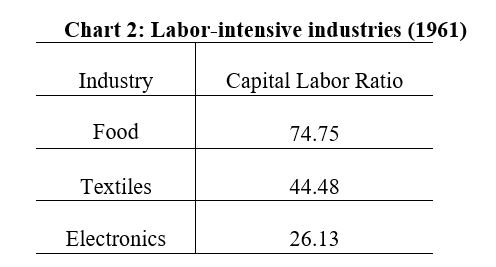
Chart 2: Labor-intensive industries (1961)
The lower the ratio of capital and labor is, the more labor-intensive the industry is. Source of information: Ranis (1979), p. 232.
The comparative advantage of a product means it costs less to produce it. The cost includes labor, land, machinery, etc. Some products require more labor to produce, while some others require more machinery or land to produce. For example, the electronics industry, in its early stage, had a relatively high labor demand. By comparison, the production of sugar in sugar factories was more dependent on heavy machinery, so its labor demand was relatively low. The former was a labor-intensive industry, while the latter was a capital-intensive industry.

Graph 17: Their Story Source of Information: Public Television Service of Foundation.(TM_03_0022)
If a product can be manufactured using a nearly fully automated production process, only a minimum of labor is required, and wages have a limited impact on the cost of this product. After the depreciation of the NT dollar in 1959, Taiwan’s wages were comparatively low, which proved helpful to the development of labor-intensive industries in Taiwan, but not so helpful to the capital-intensive industries. Chart 2 compares the capital/labor ratio of the food processing industry, the textiles industry, and the electronics industry. Of the three, the electronics industry is the most labor-intensive industry. It means that the reforms undertaken in the late 1950s was most helpful to the electronics industry in the competitive international market.
Taiwan’s food processing industry was mainly limited to the granulated sugar industry. The two stages of producing granulated sugar involved sugarcane agriculture and the production of granulated sugar. Taiwan’s production of granulated sugar might have been competitive in the world market, but growing sugarcane depended on land, and the cost of land was far more than that of other countries. Although the exchange rate reform in the late 1950s increased the competitiveness of Taiwan’s granulated sugar in the world market, but it could not influence its inevitable decline. Another disadvantageous factor for the export of Taiwan’s granulated sugar in the first post-war years was that countries importing sugar customarily bought it from a number of specific countries. As Taiwan was outside this system, its sugar exports suffered due to quota restraints.
Graph 18: Real Wage Rate
The base period is 1980. American wages are the wages of production workers; Taiwan’s wages are the average wages of the industry and service sectors. Source of information: www.measuringworth.com
Directorate General of Budget, Accounting and Statistics, Executive Yuan.
8. Stagnant wages: since 2,000 to present
Labor-intensive industries are advantageous to countries with low wages. But when these industries undergo a period of rapid growth, the wages will rise, and the comparative advantages gained from low wages will eventually disappear. Graph 18 compares changes in wages in Taiwan, Japan, and the United States, with 1980 as the base period. The continuous high growth in Taiwan between 1960 and 2000 prompted the growth of the average real wages in the industry and service sectors. However, the growth rate of wages started to slow down in the late 1990s and have remained virtually the same since 2000. This is what is referred to as “stagnant wages.”
Some may regard wage stagnation as a phenomenon peculiar to Taiwan, but that is not the case. Graph 18 shows that, the real wages of production-line labor in the United States have virtually not grown since the mid-1970s. The growth rate of Japan’s wages have also been slow since the mid-1970s. By comparison, Taiwan’s wages underwent rapid growth in the period from 1970 to the mid-1990s.
Graph 18 shows the changing trends of the wage rate for these three countries, and they reflect the same phenomenon: the differences in wages at home and abroad, as well as the offshore migration of factories. In the 1960s Taiwan’s wages were far lower than those in the United States, and this resulted in the offshore migration of American factories. This resulted in an excellent opportunity for the development of Taiwan’s electronics industry. However, the offshore migration of factories had a negative impact on the US labor market: stagnant wages and increased unemployment. For example, when the Zenith Company moved its factories producing color televisions to Mexico and Taiwan, 5,000 jobs were lost in the United States.46 When RCA moved its factories to Mexico and Taiwan in the mid-1960s, the main US factory (located in Bloomington, Indiana) underwent decline. The growth rate of Japan’s wages slowed after the 1980s, also due to the impact of the offshore migration of factories.
The term “globalization” is used in economics to explain the phenomenon of the increase of international trade and the freedom of companies to choose where to establish factories. Globalization has had different kinds of influence in different areas. In the 1960s, the US offshore migration of factories resulted in the loss of jobs within the United States and stagnant wages. However, when American factories moved to Taiwan, many job opportunities were created in Taiwan, and Taiwan’s wages grew at the same time. But with the growth of wages, the comparative advantages of Taiwan’s low wages were gradually lost, and the foreign country-owned factories moved again. Moreover, Taiwan’s local factories also moved to other countries.
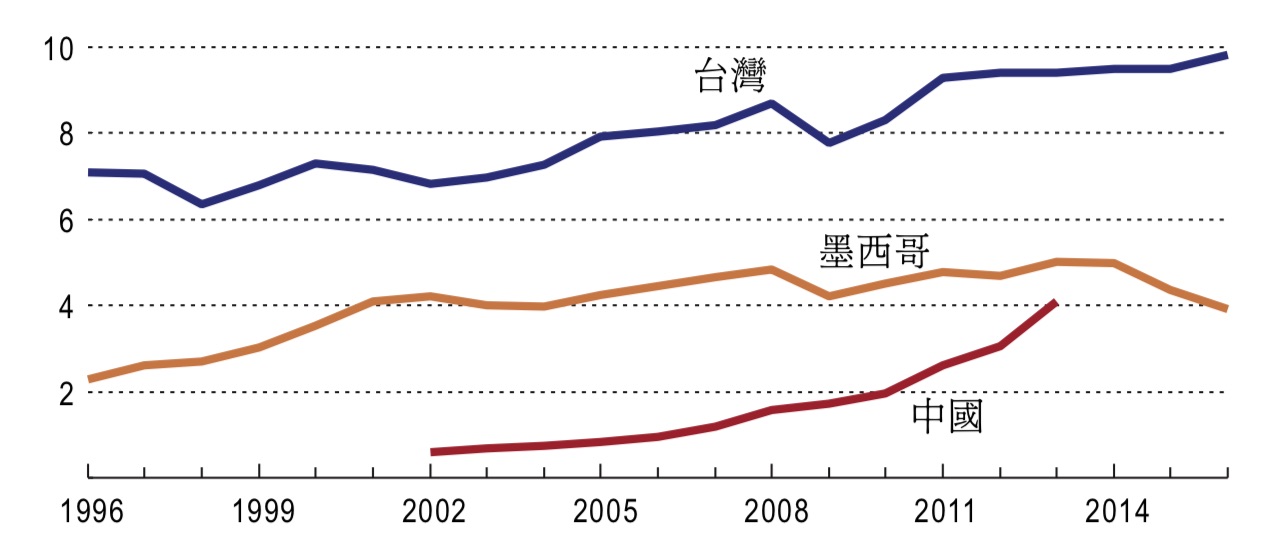
Graph 19: Hourly Labor Cost
Unit: US dollar. Source of information: BLS https://www.conference-board.org/ilcprogram/index.cfm?id=38269
Where did the factories move to? The answer is: wherever wages are low. Yet many places in the world have low wages. So companies choose production sites after taking into account a range of conditions. In the early 1970s, after the opening up of China, it proved attractive for many international companies to establish their factories there. Graph 19 compares the wages in Taiwan, China, and Mexico. For example, in 2005, the wages in China was not even 1/10th of Taiwan’s. According to a 2003 study, the average monthly salary of a production-line operator was NT$18,000-20,000, while it was NT$3,200-4,000 in Canton of China, and NT$3,200-6,000 in Shanghai.47
In the 1960s, the offshore migration of America’s factories resulted in the stagnation of wages for American workers. Likewise, the migration of Taiwan’s factories in the 1990s eventually brought about the stagnation of wages for Taiwan’s labor force.
9. The Role of Government in Economic Development
Continuous high economic growth leads to a rise in both GDP and the living standard. Thus, the high growth rate of the four Dragons in Asia is an important issue for study and is of great interest to the governments of developing countries. Some scholars think that Taiwan’s high growth was only made possible by the careful planning and effective guidance of governmental officials. The development of the textiles industry and the electronics industry proves that that was not the case.
When the period of high growth began in the early 1960s, Yin Zhong-rong was not sure how Taiwan’s economy would develop. Yin Zhong-rong passed away in 1963, but in one of his articles published in 1962, he claimed, “Anyway, we have to spare no effort to establish a few decent industries to be able to compete in the international market.” But he did not indicate which industries had such potential.48 In hindsight, the textiles industry was one of the representative industries in the expansion of Taiwan’s exports. In 1962, however, Yin Zhong-rong was not optimistic about the export of textiles: “the competition of cotton textile products is keen in the world market, and exporting them is strewn with difficulties. The US also imposes limitations on its import of our textile products49.”
However, the government did play a certain role in Taiwan’s economic development. The Report of the American Economic Advisory Group of 1954 pointed out that, in a market economy, “the government has responsibility for carrying out some most important tasks,” such as ensuring property rights, maintaining a competitive environment, resolving the problem of external costs, and improving transportation and other infrastructure. (pp.10-13) In other words, the government should place its resources in building up infrastructure to create a solid foundation for economic development. As to determining which industries are profitable and have greater potential for development, leave it up to private enterprises to explore and work out possibilities.
Reference Papers
- Arthur D. Little,Incorporated(1973a),“Perspective on Industrial Investment in Taiwan, ”Report No.5 for the Council for International Economic Cooperation and Development.
- ────(1973b),“The Outlook for the Electronics Industry in Taiwan, ”Report No.4 for the Council for International Economic Cooperation and Development.
- Hu, K.P.(1966),“The Growing Electronics Industry on Taiwan, ”Industry of Free China,26,28-33.
- Jacoby, Neil(1966), U.S. Aidto Taiwan,NewYork:FredricA.PragerPublishers.
- Jarman, RobertL.,ed.(1997),Taiwan: Political and Economic Reports:1861-1960,10vols.,Slough,U.K.:Archive Editions Limited.
- Kenney, Martin(2004),“The Shifting Value Chain:The Television Industry in North America,”in Martin Kenney and Richard Florida(eds.),Locating Global Advantage: Industry Dynamics in the International Economy, Stanford University Press,82-110.
- Kuo, Tai-chun and Ramon H. Myers(2012),Taiwan’s Economics Transformation, New York: Routledge.
- Lin, Ching-yuan(1973),Industrialization in Taiwan,1946-72,New York: Praeger.
- Little, IanM.D.(1979),“An Economic Reconnaissance,” in Walter Galenson(ed.), Economic Growth and Structural Change in Taiwan,Ithaca: Cornell University Press,448-507.
- Mackay, George Leslie(2015),The Diary of George Leslie MacKay,1871-1901,Taipei:Institute of Taiwan History, Academia Sinica.
- Maddison, Angus(2013),“Maddison Project Data Base 2013,”url:https://www.rug.nl/ggdc/historicaldevelopment/maddison/releases/maddison-project-database-2013.
- Mitchell, B.R.(2007),International Historical Statistics: The Americas, 1750-2005, 6thed., New York: Macmillan.
- Office of Techonology Assessment(1983), International Competitivenessin Elec-tronics, Washington, D.C.:Office of Techonology Assessment, U.S. Congress.
- Ranis, Gustav(1979),“Industrial Development,” in Walter Galenson(de.),Eco-nomic Growth and Structural Change in Taiwan,Ithaca:Cornell University Press,206-262.
- Schive, Chi(1990),Foreign Factor, Stanford, CA.: Hoover Press Publication.
- Scott, Maurice(1979), “Foreign Trade,” in Walter Galenson(ed.), Economic Growth and Structural Change in Taiwan, Ithaca:Cornell University Press,308-383.
- Zamora, Elizabeth and Jacob Kirchmer(2010),“Compensation costs in manufacturing across in dustries and countries, 1975-2007,” Monthly Labor Review,32-54.
- 小田俊郎(1995),《臺灣醫學50年》,洪有錫(譯),臺北:前衛。尹仲容(1954),“臺灣經濟的困難與出路”,《我對臺灣經濟的看法全集(續編)》,36-47。
- ────(1960),“兩年來的外匯貿易改革”,《我對臺灣經濟的看法全集(三編)》,6-12。
- ────(1963a),“如何平衡臺灣的國際收支”,《我對臺灣經濟的看法全集(初編)》,32-35。
- ────(1963b),“我國對外經濟情勢報告”,《我對臺灣經濟的看法全集(三編)》,266-267。
- ────(1963c),“從臺幣改革泛論目前臺灣的經濟情形”,《我對臺灣經濟的看法全集(初編)》,21-27。
- ────(1963d),“發展臺灣經濟之路”,《我對臺灣經濟的看法全集(四編)》,25-29。
- ────(1963e),“對當前外匯貿易管理政策及辦法的檢討”,《我對臺灣經濟的看法全集(續編)》,130-149。
- ────(1963f),“臺灣生產事業的現在與未來”,《我對臺灣經濟的看法全集(初編)》,7-20。
- 吳聰敏(1997),“1945-1949年國民政府對臺灣的經濟政策”,《經濟論文叢刊》,25,521-54。
- ────(2016),“從經濟管制到出口擴張:臺灣1946-1960”,臺大經濟系。
- ────(2017a),“臺灣國內生產毛額之估計:1905-1950”,臺大經濟系。
- ────(2017b),“進口替代與臺灣糖業帝國的興衰”,臺大經濟系。
- 李仙得(2013),《李仙得臺灣紀行》,羅效德與費德廉(譯),臺南:國立臺灣歷史博物館。
- 邢慕寰(1993),“尹仲容先生與我的一段交往”,邢慕寰(編),《臺灣經濟策論》,237-242。
- 林邦充(1969),“臺灣之棉紡工業”,《臺灣銀行季刊》,20,76-125。
- 林榮芳(1972),“臺灣電子工業中之僑外資”,《臺灣銀行季刊》,22,172-178。施坤生,周建新,與蘇震(1961),“臺灣貿易外匯之研究”,《臺灣銀行季刊》,20,83-125。
- 張德粹(1967),《臺灣砂糖保證價格之研究》,臺北:臺灣糖業公司與中國農村經濟學會。
- 陳榮富(1956),《六十年來臺灣之金融與貿易》,臺北:三省書店。
- 陸軍参謀本部陸地測量部(1896),《臺灣諸景寫真帖》,東京:陸地測量部。
- 黃東之(1956),“臺灣之棉紡工業,”《臺灣銀行季刊》,7,1-33。
- 溝口敏行(2008),《アジア長期經濟統計I:臺灣》,東京:東洋經濟新報社。
- 經建會部門計畫處(1980),“我國電子工業現狀與評估(上)”《自由中國之工業》,54,13-23。
- 雷柏爾,全漢昇,與陳紹馨(1954),《臺灣之城市與工業》,臺北:美國國外業務總署駐華共同安全分署與國立臺灣大學。
- 臺灣總督府民政部(1915),《記念臺灣寫真帖》,臺北:臺灣總督府民政部。
- 劉克襄(1989),《橫越福爾摩沙》,臺北:自立報系。
- 劉敏誠(1968),“從一家外資電子工廠看婦女就業新天地,”《今日經濟》,54-56。
- 蕭峰雄(1994),《我國產業政策與產業發展》,臺北:遠東經濟研究顧問社。